
How to get synthetics monitoring to work in new relic
How to get synthetics monitoring to work in new relic? New Relic is an application monitoring software that provides monitoring and performance management capabilities for websites,customer experience, and overall business outcomes.
What is synthetic monitoring?
Synthetic monitoring, also known as active monitoring or proactive monitoring, is a technique used in the field of IT systems and application monitoring. It involves simulating user interactions and transactions to monitor the performance and availability of applications, networks, and other IT infrastructure components.
How to get synthetics monitoring to work in new relic?
To set up synthetic monitoring in New Relic, follow these steps:
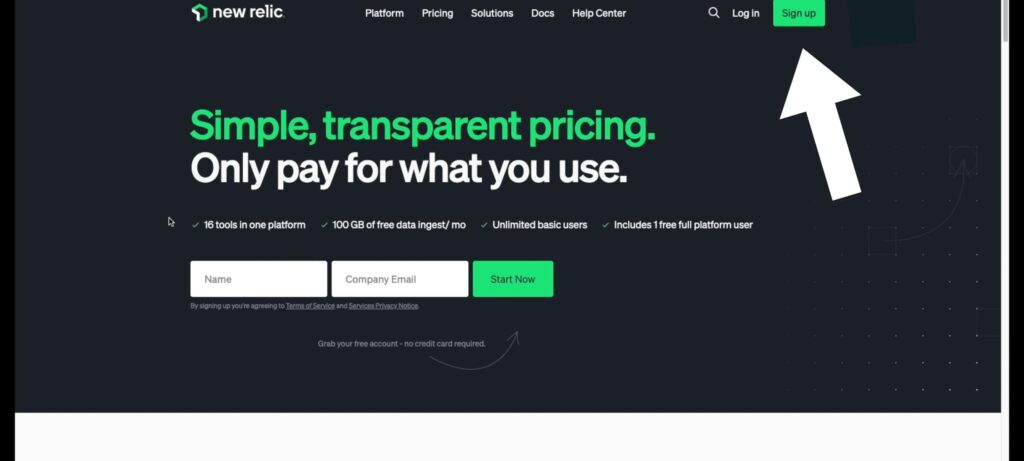
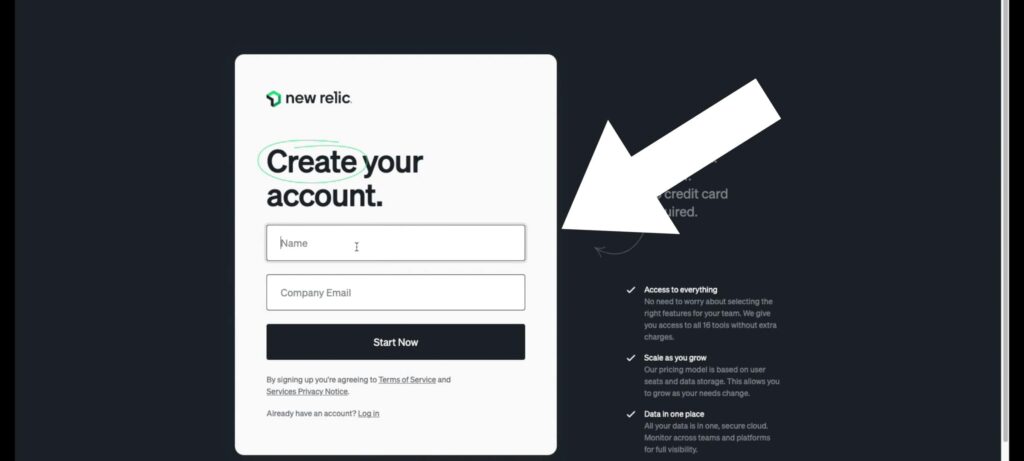
STEP 1.Sign in to your New Relic account for set up synthetics monitoring: If you don’t have an account, sign up for one at the New Relic website (https://newrelic.com/). Just give your name and Email.
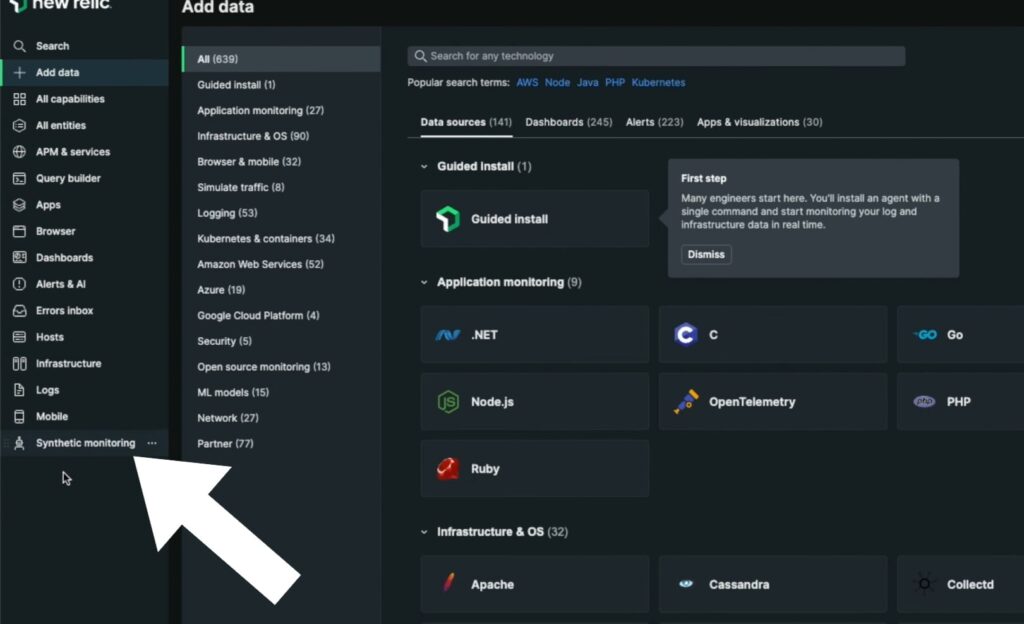
STEP 2. Access the New Relic user interface: Once signed in, navigate to the New Relic user interface. You will see synthetic monitoring and just click on it.
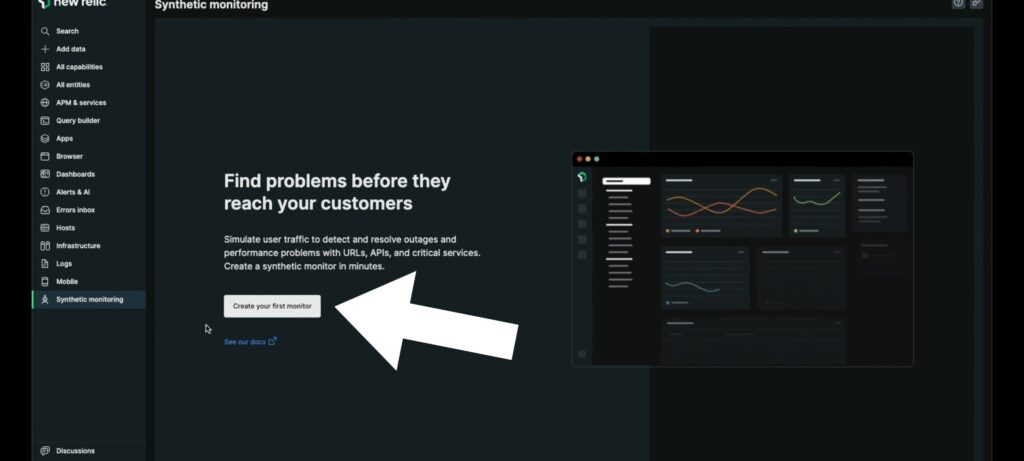
STEP 3. Create a synthetic monitor: now you will see “create your first monitor” and then click on it.
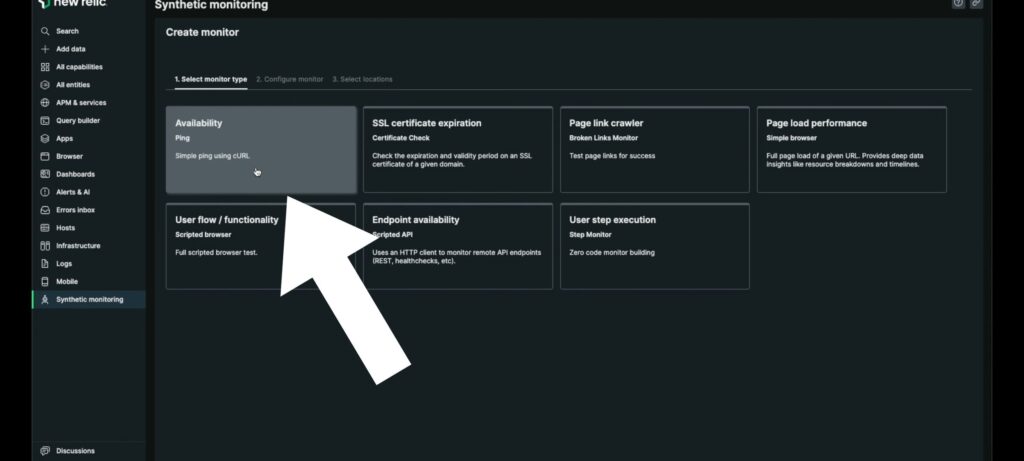
STEP 4. Choose monitor type: New Relic provides various monitor types such as Ping, Simple Browser, Scripted Browser, and API Test. Select the appropriate monitor type based on your monitoring needs. you select availability.
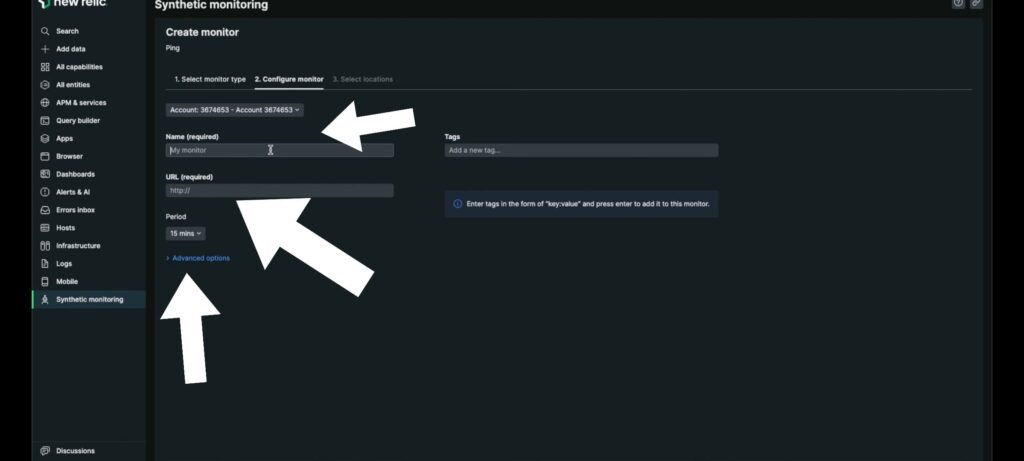
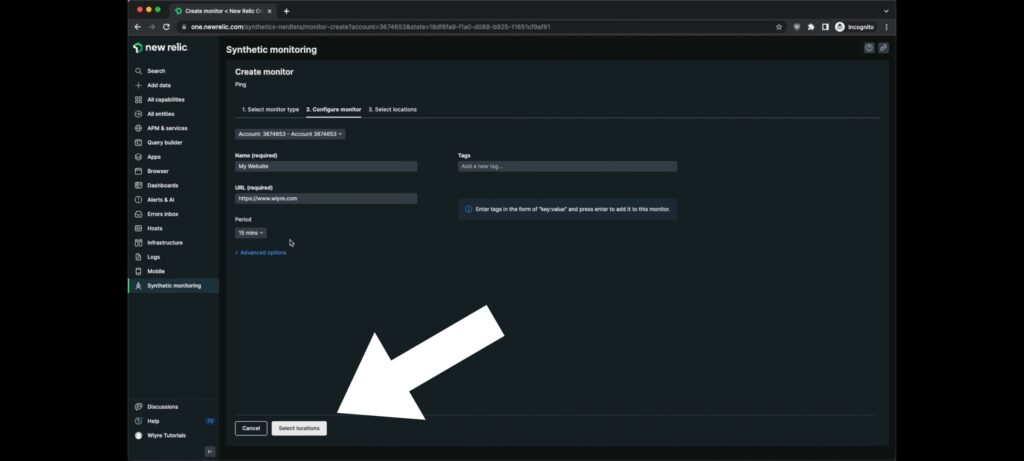
STEP 5. Configure the monitor: Fill in the required details for the monitor configuration. This includes specifying the monitor name, URL to monitor, location, frequency, and other relevant settings based on the monitor type you selected. especially follow the steps name, website url and period.
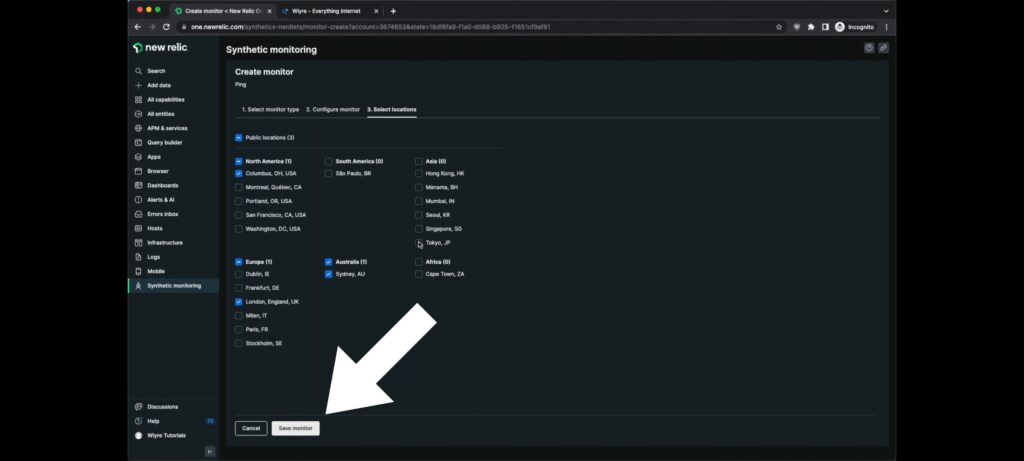
STEP 6. Save and activate the monitor: After configuring the monitor and defining alert conditions, save your changes and activate the monitor. New Relic will start monitoring the specified URL based on the defined frequency.
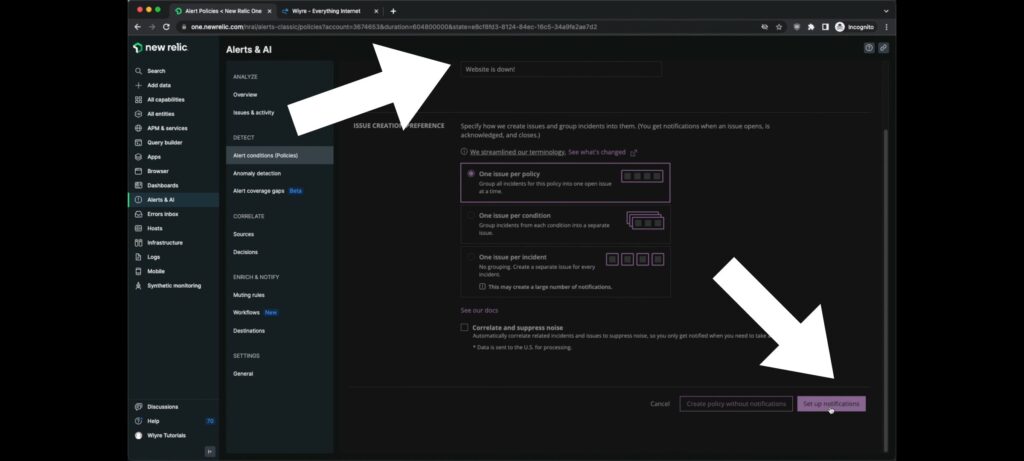
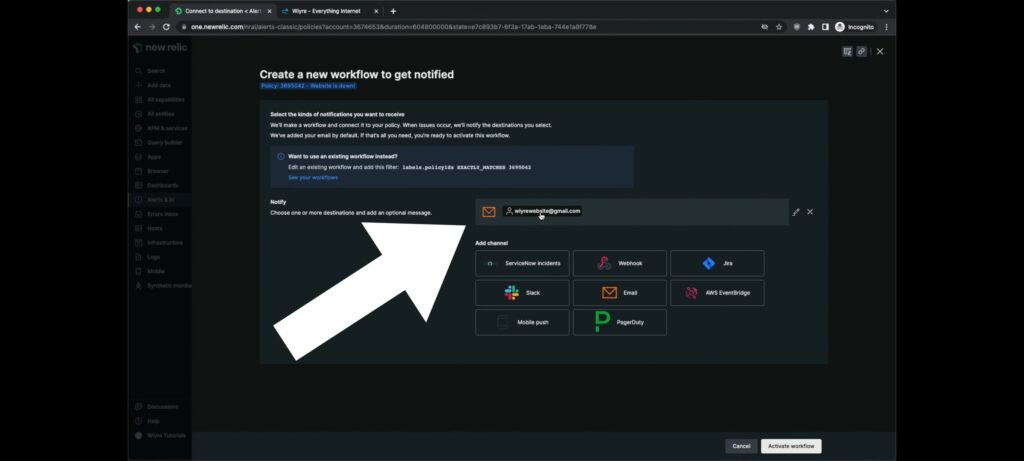
STEP 7.Define alert conditions: Set up the conditions that will trigger alerts. You can set thresholds for response time, error rate, or specific error messages. Choose the alerting channels you want to use, such as email, Slack, or other integrated incident management systems. and click on “start a new policy”.
Review monitoring results: Once the monitor is active, you can view the monitoring results and performance data in the New Relic user interface. This includes response times, error rates, screenshots, and other relevant metrics.
STEP 8. Optimize and fine-tune: Analyze the monitoring data to identify any performance issues or errors. Based on the insights gained, you can fine-tune the monitor settings, adjust alert conditions, or make improvements to your application. In the alert section, write a policy name and set notification. More importantly, give them an email address, and they will send you a notification if they find anything wrong with the website.
If you are not clear yet about how to get synthetinc monitoring to work in New Relic, Watch this video; I think you can easily understand it.
Advantages of synthetic monitoring:
Synthetic monitoring offers several advantages that make it a valuable tool for monitoring IT systems and applications.Here are some of the key benefits: How to get synthetic monitoring to work in New Relic
- Proactive Issue Detection: Synthetic monitoring allows you to identify potential issues before they impact real users. By simulating user interactions and transactions, you can catch performance problems, errors, and bottlenecks early on, enabling you to take proactive measures to address them.
- End-to-End Visibility: Synthetic monitoring provides end-to-end visibility into the entire user journey within an application or system. It helps you understand the performance and availability of critical functionalities, such as page load times, form submissions, or specific workflows. This comprehensive view allows you to pinpoint and resolve issues that might affect user experience.
- Performance Baseline Establishment: Synthetic monitoring helps establish performance baselines by continuously monitoring key metrics like response time, latency, and availability. This baseline data serves as a reference point for measuring and comparing future performance, allowing you to identify deviations and anomalies.
- Geographic and Load Testing: Synthetic monitoring tools can simulate user interactions from different geographic locations and various network conditions. This capability helps identify regional performance variations, detect content delivery network (CDN) issues, and evaluate the impact of high user loads on system performance.
- SLA Monitoring: Synthetic monitoring allows you to monitor and validate service level agreements (SLAs) with third-party vendors or cloud service providers. By continuously running synthetic tests, you can ensure that the agreed-upon performance targets are met and take necessary actions if SLA violations occur.
- Pre-production Testing: Synthetic monitoring is particularly useful in pre-production environments, where user traffic is limited. It helps assess system behavior, performance, and scalability under simulated user loads, ensuring that the application or system can handle real-world usage scenarios.
- Early Warning System: Synthetic monitoring acts as an early warning system by immediately alerting you to performance or availability issues. Timely notifications enable IT teams to investigate and resolve problems proactively, minimizing the impact on end users and preventing potential business disruptions.
- Continuous Improvement: Synthetic monitoring data can be used for continuous improvement of IT systems and applications. By analyzing performance trends and patterns, you can identify areas for optimization, fine-tune configurations, and make informed decisions about infrastructure upgrades or changes.
Frequently Asked question:
Q: What is New Relic?
A: New Relic is a software analytics platform that helps businesses monitor, troubleshoot, and optimize their applications and infrastructure. It provides real-time insights and performance metrics to help improve application performance, customer experience, and overall business outcomes.
Q: What types of monitoring does New Relic offer?
A: New Relic offers various monitoring solutions, including application performance monitoring (APM), infrastructure monitoring, synthetic monitoring, mobile monitoring, browser monitoring, and serverless monitoring. These solutions provide visibility into different aspects of your applications and infrastructure.
Q: How does New Relic’s application performance monitoring (APM) work?
A: New Relic APM helps monitor and analyze the performance of your applications. It collects data on transaction times, database queries, external service calls, error rates, and other performance-related metrics. This data is presented in the New Relic user interface, allowing you to identify bottlenecks, troubleshoot issues, and optimize application performance.
Q: What is infrastructure monitoring in New Relic?
A: Infrastructure monitoring in New Relic allows you to monitor the health and performance of your servers, containers, and cloud infrastructure. It provides insights into CPU usage, memory usage, disk I/O, network activity, and other system-level metrics. This helps you identify resource utilization, capacity planning, and performance optimization opportunities.
Q: What is synthetic monitoring in New Relic?
A: Synthetic monitoring in New Relic involves simulating user interactions with your application or website to monitor its performance and availability. Synthetic monitors run automated tests from various locations and provide insights into response times, error rates, and other metrics. It helps you proactively detect and address issues before real users are impacted.
Q: How does New Relic’s mobile monitoring work?
A: New Relic’s mobile monitoring enables you to gain visibility into the performance of your mobile applications. It collects data on user interactions, app crashes, network requests, and other mobile-specific metrics. This allows you to understand user experience, identify performance issues, and optimize your mobile apps.
Q: Can New Relic be integrated with other tools and services?
A: Yes, New Relic can be integrated with a wide range of tools and services. It provides integrations with popular DevOps, incident management, and collaboration tools such as Slack, Jira, PagerDuty, and many more. These integrations enable seamless workflows and enhance the visibility of your application’s performance and incidents.
Q: Is New Relic suitable for cloud-based applications?
A: Yes, New Relic is well-suited for monitoring cloud-based applications. It supports monitoring applications deployed on various cloud platforms like Amazon Web Services (AWS), Microsoft Azure, Google Cloud Platform (GCP), and others. New Relic provides specific integrations and features tailored to these cloud environments.
Q: How can I get started with New Relic?
A: To get started with New Relic, you can visit the New Relic website (https://newrelic.com/) and sign up for an account. New Relic offers different plans, including free tiers, to accommodate various needs. Once you sign up, you can follow the provided documentation and guides to set up monitoring for your applications and infrastructure.
Q: Can I customize and optimize my synthetic monitors in New Relic?
A: Yes, you can customize and optimize your synthetic monitors in New Relic. Based on the insights gathered from monitoring results, you can fine-tune the monitor settings, adjust alert conditions, or make improvements to your application to enhance performance and reliability.
Q: How do I analyze the results of synthetic monitoring in New Relic?
A: Once your synthetic monitor is active, you can review the monitoring results and performance data in the New Relic user interface. This includes metrics such as response times, error rates, screenshots, and other relevant information. You can analyze the data to identify performance issues or errors and take appropriate actions.
Q: How can I receive alerts for synthetic monitoring in New Relic?
A: In New Relic, you can define alert conditions for your synthetic monitors. You can set thresholds for response time, error rates, or specific error messages. Alerts can be delivered through various channels such as email, SMS, Slack, or integrated incident management systems.